
Power BI is a powerful business intelligence and data analytics tool that helps professionals connect to data, transform and analyze information, and create interactive reports and dashboards. For data analysts, developing the right Power BI skills—from data preparation and modeling to DAX calculations and report design—is essential for turning raw data into meaningful business insights.
In this article, we explore five essential Power BI skills every data analyst should know. To follow along and practice these skills, you can download Power BI Desktop from Microsoft.
Here are five Power BI skills that can help you move from simply creating visuals to building useful business reports.
1. Connecting Power BI to Data
Before you can build a report, Power BI needs data.
That data may come from many different sources, including:
Microsoft Excel workbooks
CSV or text files
SQL Server databases
Web-based sources
SharePoint
Cloud services
Other business applications
How to Connect to Data in Power BI Desktop
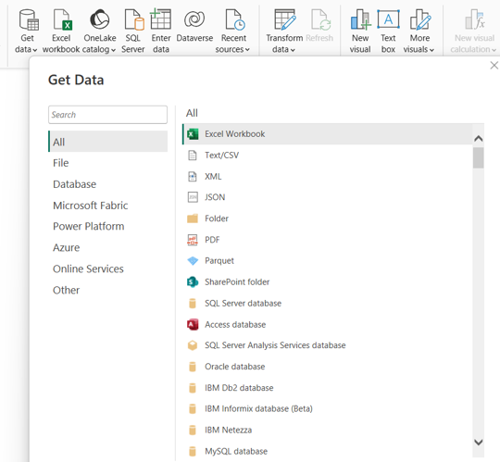
Use Get data in the Power BI desktop ribbon to connect to any data.
Why this skill matters
Organizations often need to analyze data from multiple sources. For example, sales data may come from Excel, customer information from a database, and other business information from cloud-based applications. Understanding how to connect Power BI to different data sources is an essential first step in building useful reports and dashboards.
2. Cleaning and Transforming Data With Power Query
Real-world data is rarely ready for analysis immediately after it is imported.
You may encounter:
Blank rows
Missing values
Incorrect data types
Unnecessary columns
Inconsistent text
Duplicate records
Multiple files that need to be combined
Power BI includes Power Query Editor, which allows you to clean and transform data before using it in your reports.
How to access Power Query Editor
Power Query editor can be accessed from Power BI Desktop by selecting Transform data from the Home tab.
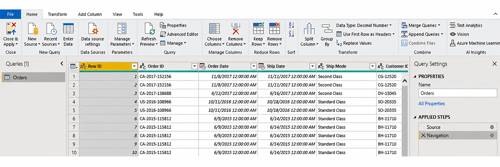
Note: Power Query Editor can also be used to connect to data.
Why this skill matters
A visually impressive dashboard is not very useful if the underlying data is incorrect.
Consider a report showing sales by month. If some Order Date values are missing or stored incorrectly, the monthly sales totals may also be incomplete or misleading.
This is why data preparation is such an important part of data analysis.
Good reporting starts with good data.
Learning data cleaning techniques using Power Query Editor helps analysts spend less time manually fixing spreadsheets and more time working with repeatable data-preparation steps.
3. Building Relationships Between Tables
Business data is frequently stored across multiple tables. For example, in an enterprise, Customer Orders may be stored in an Orders table, Customer information may be stored in Customers table, Product information may be stored in Products and Category tables, and Sales Person’s information may be stored in a separate table.
To create Visualizations to display information from all of these tables, Power BI can create relationships between these tables.
Relationships are created using columns that contain related data, such as CustomerID or ProductID. Power BI also considers the cardinality of the relationship, such as one-to-many or one-to-one.
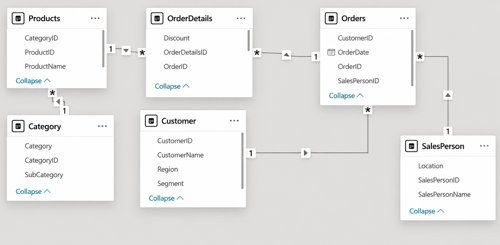
How to Create Relationships in Power BI
Relationships can be created by selecting Manage relationships from the ribbon. In the Manage relationships dialog box, select the required tables and columns containing related data.
To learn more about creating relationships read: How to create relationships in Power BI.
Why relationships matter
Power BI is not simply a visualization tool. It also has a data modeling layer.
If relationships are designed incorrectly, calculations and visuals can produce unexpected results.
4. Creating Measures With DAX
Once your data has been imported and organized, you usually need calculations to create columns which does not exist in your data model or to implement business rules.
Power BI uses a formula language called DAX, or Data Analysis Expressions, to create measures, calculated columns, and calculated tables.
For example, if your Sales table contains a Sales column, you might create a measure:
Total Sales
Total Sales = SUM(Sales[Sales Amount])
If the table also contains Profit, you might create:
Total Profit
Total Profit = SUM(Sales[Profit])
You could then calculate profit margin:
Profit Margin
Profit Margin = DIVIDE([Total Profit], [Total Sales])
These measures can be used throughout a Power BI report.
Why measures matter
Measures allow analysts to create calculations that respond to the context of a report. Understanding DAX measures is important because they help answer business questions such as:
How much did we sell this quarter?
Which region performed best?
What is our profit margin?
How does this year's performance compare with last year?
DAX helps turn these business questions into calculations that can be used throughout a Power BI report.
If you already have experience with Excel formulas and data analysis, some Power BI concepts may feel familiar. If you're deciding which skill to develop first, read our guide, Excel vs. Power BI: Which One Should You Learn First?
5. Building Visualizations That Help People Make Decisions
After preparing the data, creating relationships, and defining calculations, you can begin building visualizations that communicate the results of your analysis.
How to create Visualizations
Visualizations are created in the Power BI desktop by using the fields from the loaded tables and calculations. Power BI provides variety of visualizations, including:
Bar and column charts
Line charts
Tables
Matrices
Cards
Maps
Slicers
KPI-style visuals
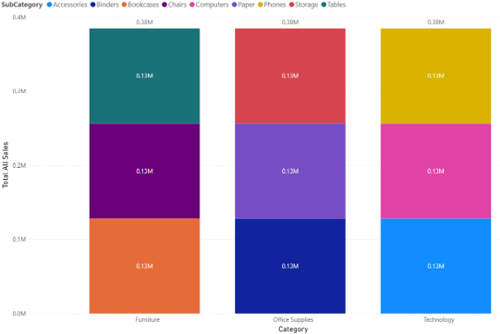
Why Visualization matters
Visualizations help users understand data more quickly. Instead of reviewing thousands of rows, managers can use charts, cards, and other visuals to identify important KPIs, patterns, and trends at a glance.
Choosing the appropriate visualization is also important. For example, a bar chart can be useful for comparing values across categories, while a line chart is often appropriate for showing how a measure such as sales changes over time.
Five Power BI Skills Working Together
These five skills work together as part of the Power BI reporting process.
For example, suppose your organization wants to analyze customer sales and order data. You might:
1. Connect to the data set, it may be one Excel sheet with sales data or multiple data sets from different sources.
2. Transform the data using Query Editor.
3. Create relationships between Sales, Customer, Product, and Date tables.
4. Build DAX measures for Sales, Profit, and Profit Margin.
5. Present the results through appropriate visuals and filters.
Each skill supports the next one.
A chart or a visual is the final presentation of the analysis. A significant amount of work happens before that visualization can be trusted.
Final Thoughts
Power BI can be an excellent skill for professionals who want to work with data, reporting, business intelligence, or analytics.
To become proficient in Power BI, focus on developing these five core skills:
Connecting to data
Cleaning and transforming data with Query Editor
Building relationships between tables
Creating measures with DAX
Designing reports that help people make decisions
Together, these skills give you a foundation for moving from raw business data to useful information.
Professionals who want structured, hands-on practice can explore our Power BI Training at Ohio Computer Academy.
Frequently Asked Questions
Is Power BI difficult to learn for beginners?
Power BI is approachable for beginners, especially for professionals who already have experience with Excel. Start with importing data, basic Power Query transformations, simple visuals, and basic measures before moving into more advanced data modeling and DAX.
Do I need to know Excel before learning Power BI?
Although Excel knowledge is not required to learn Power BI, familiarity with Excel formulas, tables, and data analysis can be beneficial and may make some Power BI concepts easier to understand. If you're new to Excel and want to build a strong foundation, explore our Excel Basics to Advanced training.
Do I need to learn DAX to use Power BI?
You can create simple Power BI reports without extensive DAX knowledge. However, DAX becomes increasingly important when you need custom calculations, business metrics, comparisons, and more sophisticated analysis.
Why Power Query Editor is used in Power BI?
Power Query Editor is used to connect to, clean, reshape, and transform data before it is used in the Power BI data model. It can help make repeatable data-preparation processes more efficient.
Is Power BI replacing Excel?
No. Excel and Power BI serve overlapping but different purposes and are often used together. Excel remains valuable for spreadsheet analysis and flexible calculations, while Power BI is particularly useful for data modeling, interactive reporting, and repeatable business intelligence.

Chandraish Sinha is the Founder and President of Ohio Computer Academy, a leading institution committed to delivering high-quality IT education. With a passion for teaching and a belief in his company’s mission—Inspire, Educate & Evolve—Chandraish brings over 25 years of experience in the Information Technology industry.
Explore more of his work on his Amazon Author Profile.
0 Comments
0 Comments


Post a Comment